PyCharm Professional docker-compose configuration
These instructions show how to configure PyCharm Professional to use a docker-compose configuration, which allows development and testing of devices that requires interactions with other live devices. Follow the steps below to configure PyCharm to run tests from the tango-example project that require a live Tango system.
Prerequisites
We recommend you be comfortable with PyCharm and the standard PyCharm Docker configuration before using docker-compose.
Please follow the steps in the PyCharm Professional Docker configuration topic for some basic familiarity with PyCharm and Docker.
Goal
In the Docker configuration, PyCharm used the Python interpreter inside the powersupply:latest image for development and testing.
The docker-compose.yml file for the tango-example project declares three containers:
- tangodb: the relational database used for the Tango installation.
- databaseds: a container running the device service for the Database.
- powersupply: a container running the PowerSupply device itself.
We want PyCharm to take the place of the powersupply container, so that tests execute against the code we are developing. As a result, unit tests should execute in an additional container created for the duration of the test.
Registering the device server
Tango devices must be registered so that other devices and clients can locate them. The docker-compose.yml entry for the powersupply service automatically registers the powersupply device. However, this automatic registration is not performed when PyCharm launches the service Manual device registration is easily performed from an interactive session. The example below registers a test instance of the powersupply device:
mypc:tango-example tangodeveloper$ make interactive
docker build  -t nexus.engageska-portugal.pt/tango-example/powersupply:0.1.0-067e5b3-dirty . -f Dockerfile --build-arg DOCKER_REGISTRY_HOST=nexus.engageska-portugal.pt --build-arg DOCKER_REGISTRY_USER=tango-example
Sending build context to Docker daemon  914.4kB
Step 1/4 : FROM nexus.engageska-portugal.pt/ska-docker/ska-python-buildenv:latest AS buildenv
# Executing 3 build triggers
 ---> Using cache
 ---> Using cache
 ---> Using cache
 ---> 10811adeaf7d
Step 2/4 : FROM nexus.engageska-portugal.pt/ska-docker/ska-python-runtime:latest AS runtime
# Executing 6 build triggers
 ---> Using cache
 ---> Using cache
 ---> Using cache
 ---> Using cache
 ---> Using cache
 ---> Using cache
 ---> 1d24e7c0f8aa
Step 3/4 : RUN ipython profile create
 ---> Using cache
 ---> 93c8f22c5f87
Step 4/4 : CMD ["/venv/bin/python", "/app/powersupply/powersupply.py"]
 ---> Using cache
 ---> b54df79f52d6
[Warning] One or more build-args [DOCKER_REGISTRY_HOST DOCKER_REGISTRY_USER] were not consumed
Successfully built b54df79f52d6
Successfully tagged nexus.engageska-portugal.pt/tango-example/powersupply:0.1.0-067e5b3-dirty
docker tag nexus.engageska-portugal.pt/tango-example/powersupply:0.1.0-067e5b3-dirty nexus.engageska-portugal.pt/tango-example/powersupply:latest
DOCKER_REGISTRY_HOST=nexus.engageska-portugal.pt DOCKER_REGISTRY_USER=tango-example docker-compose up -d
tango-example_tangodb_1 is up-to-date
tango-example_databaseds_1 is up-to-date
tango-example_powersupply_1 is up-to-date
docker run --rm -it --name=powersupply-dev -e TANGO_HOST=databaseds:10000 --network=tango-example_default \
      -v /Users/stewartwilliams/PycharmProjects/tango-example:/app nexus.engageska-portugal.pt/tango-example/powersupply:latest /bin/bash
tango@0f360f86d436:/app$ tango_admin --add-server PowerSupply/test PowerSupply test/power_supply/1
Configure the remote interpreter
Following the official PyCharm documentation, configure Docker Compose as a remote interpreter. Use the
docker-compose.yml file found in the root of the tango-example project, and set the service to powersupply. The
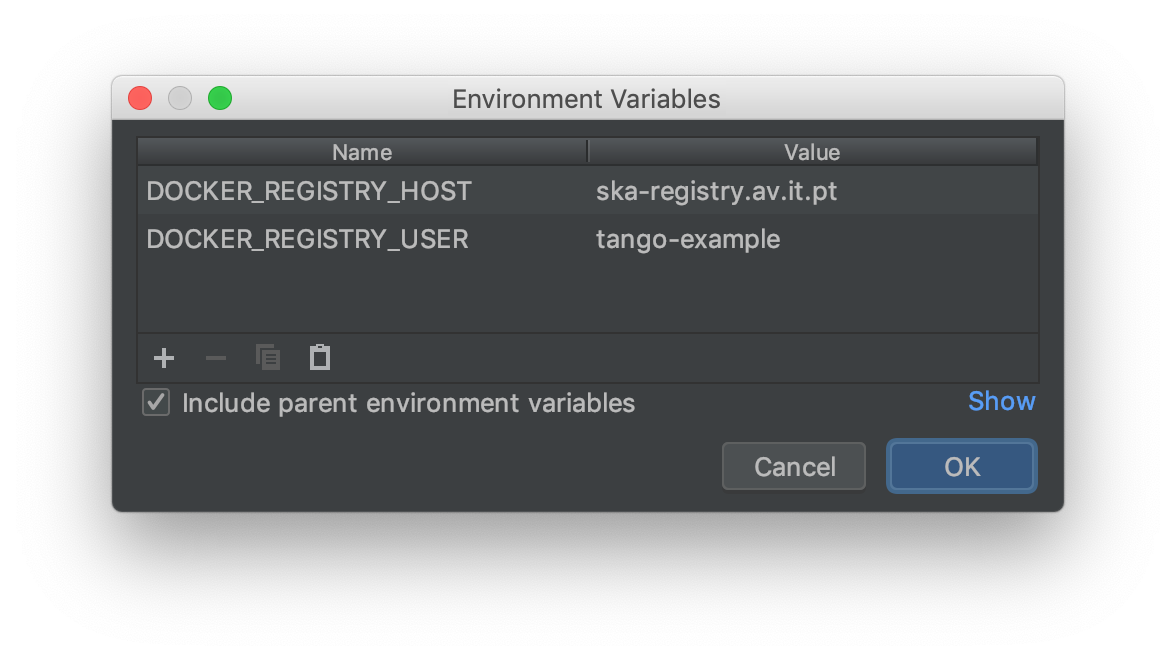
docker-compose.yml file expects the DOCKER_REGISTRY_HOST and DOCKER_REGISTRY_USER arguments to be provided.
Normally these would be provided by the Makefile, but as we are running outside Make then these variables need to be
defined. Set the environment variables to look like this:
The final Configure Remote Python Interpreter dialog should look like this:
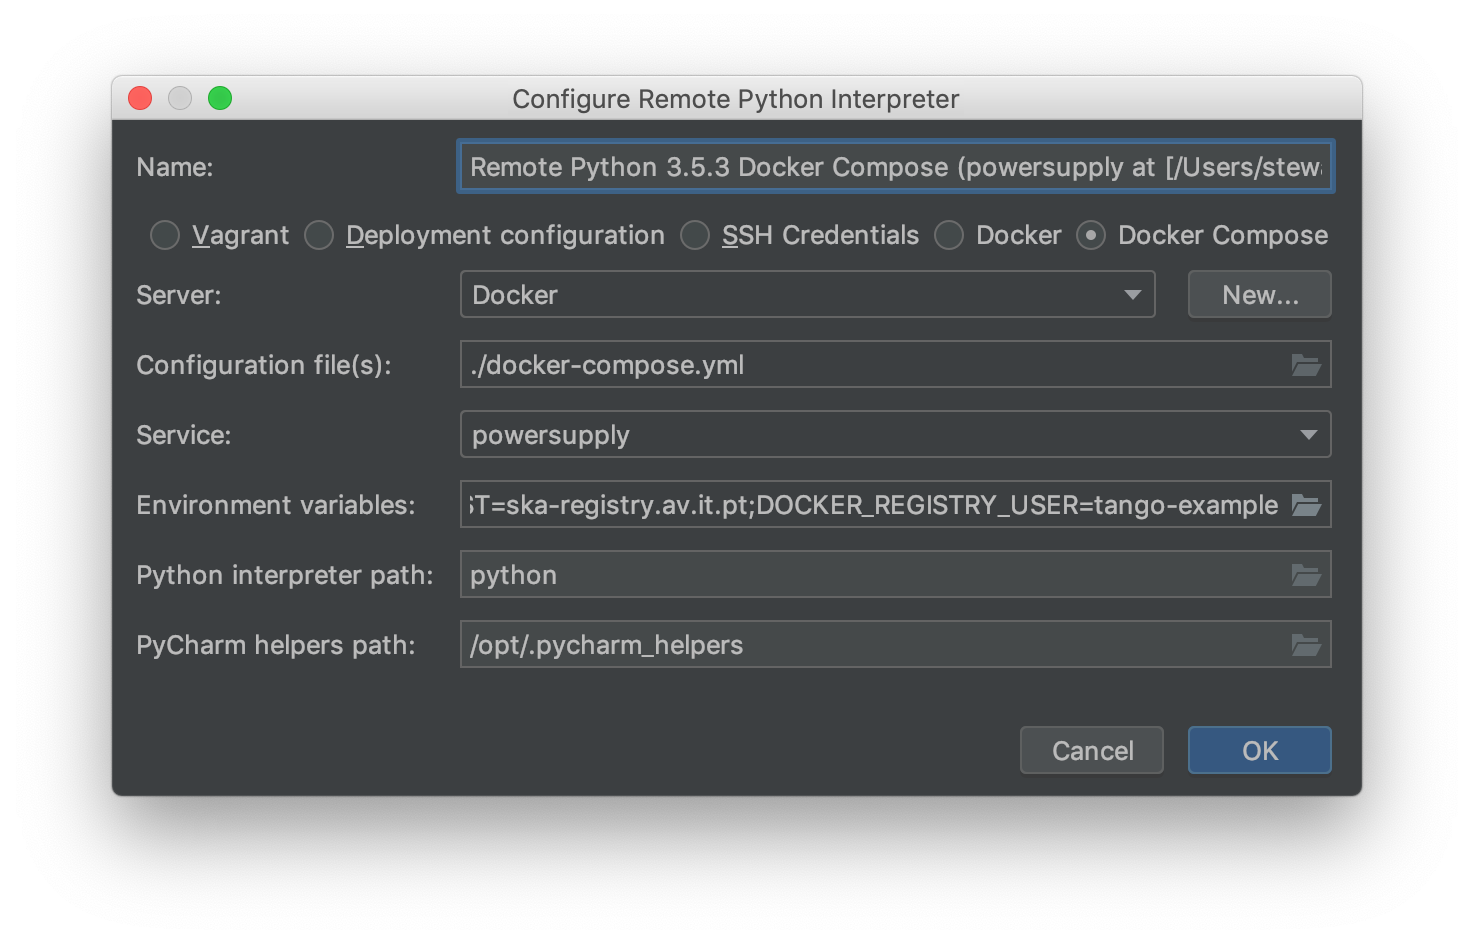
Click ‘OK’ to apply your changes.
You can now navigate through the project. As an exercise, open the source code for the PowerSupply class, which is defined in powersupply/powersupply.py. Like the Docker configuration, notice that the IDE notifications and intellisense / code completion are now based on information gathered from the remote Docker image.
Just as for the Docker configuration, whenever you change the Python environment you should regenerate the project skeletons to make PyCharm aware of the changes. To do this, select File | Invalidate Caches / Restart… from the main menu.
Running the device
From the main menu, choose Run | Edit Configurations… and click on the ‘+’ button to add a new configuration. From the menu that appears, select Python to add a new Python execution configuration. In the dialog, perform these steps:
- Edit the script/module to be executed to point to the
powersupply.powersupplymodule. - Add
testas an execution parameter; this tells the PowerSupply device to execute as the PowerSupply/test instance we registered earlier. - Change the working directory to the root of the project.
The final Run/Debug dialog should look like this:
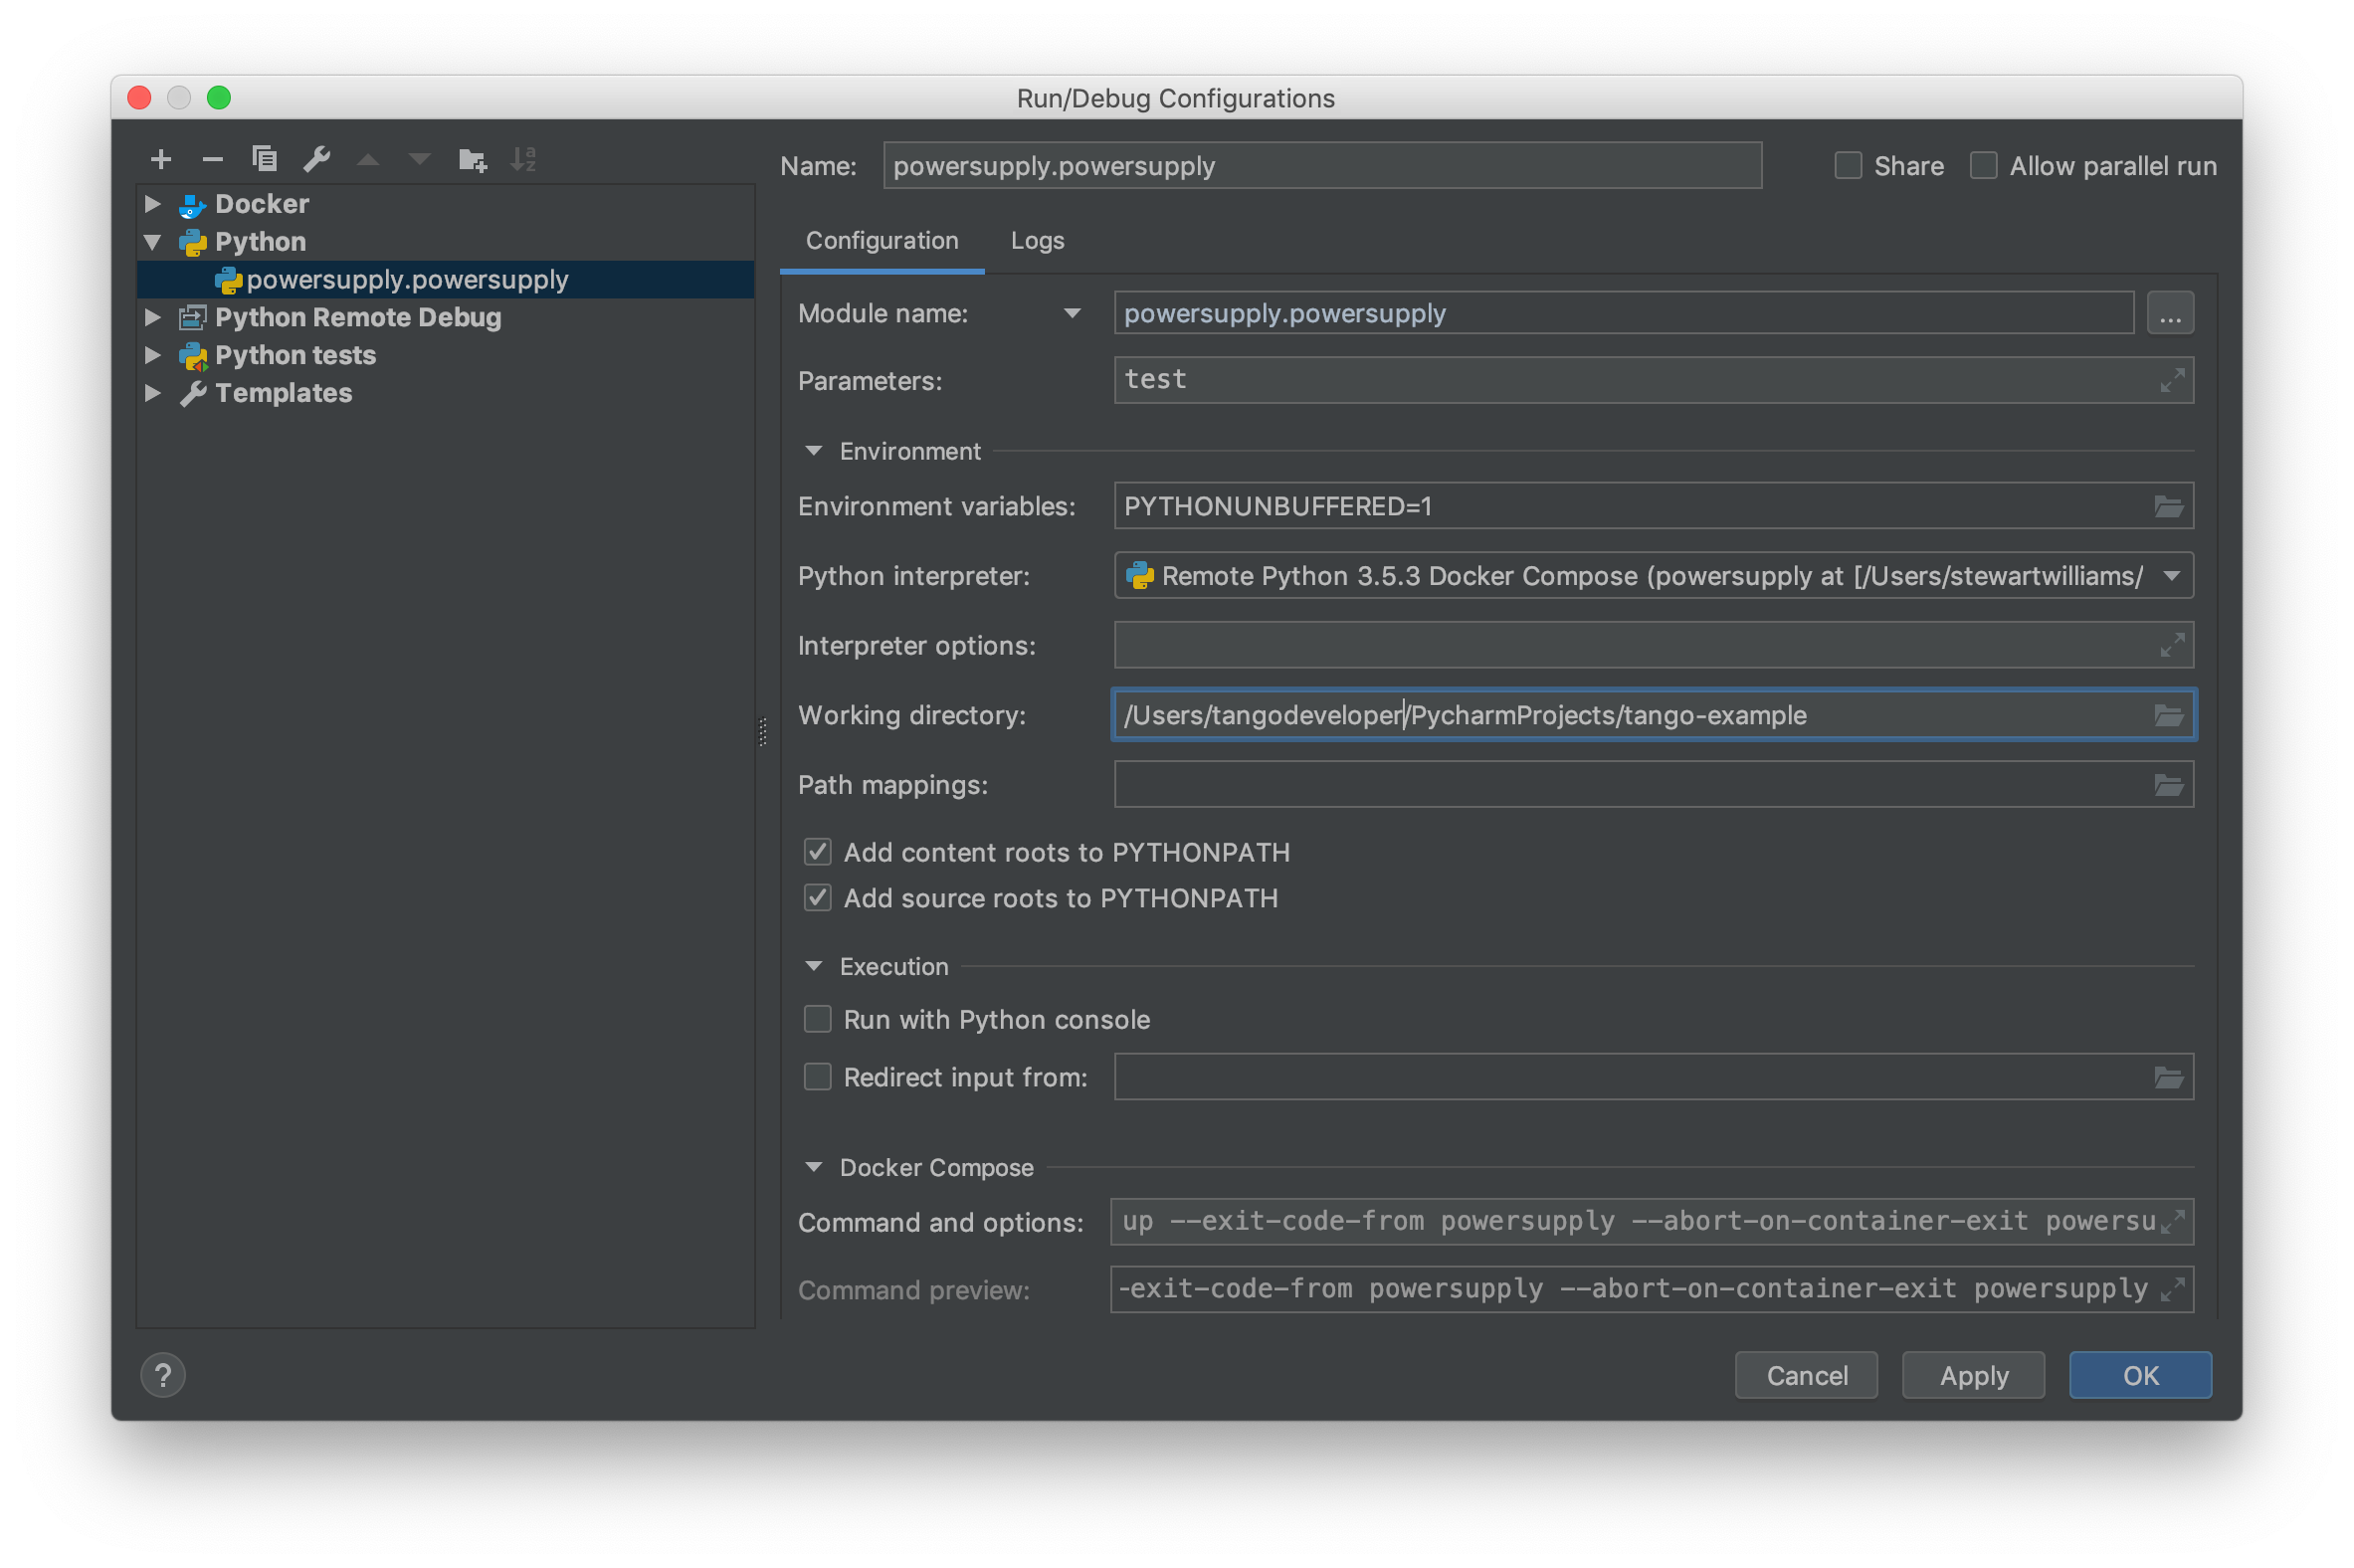
Press OK to apply your changes.
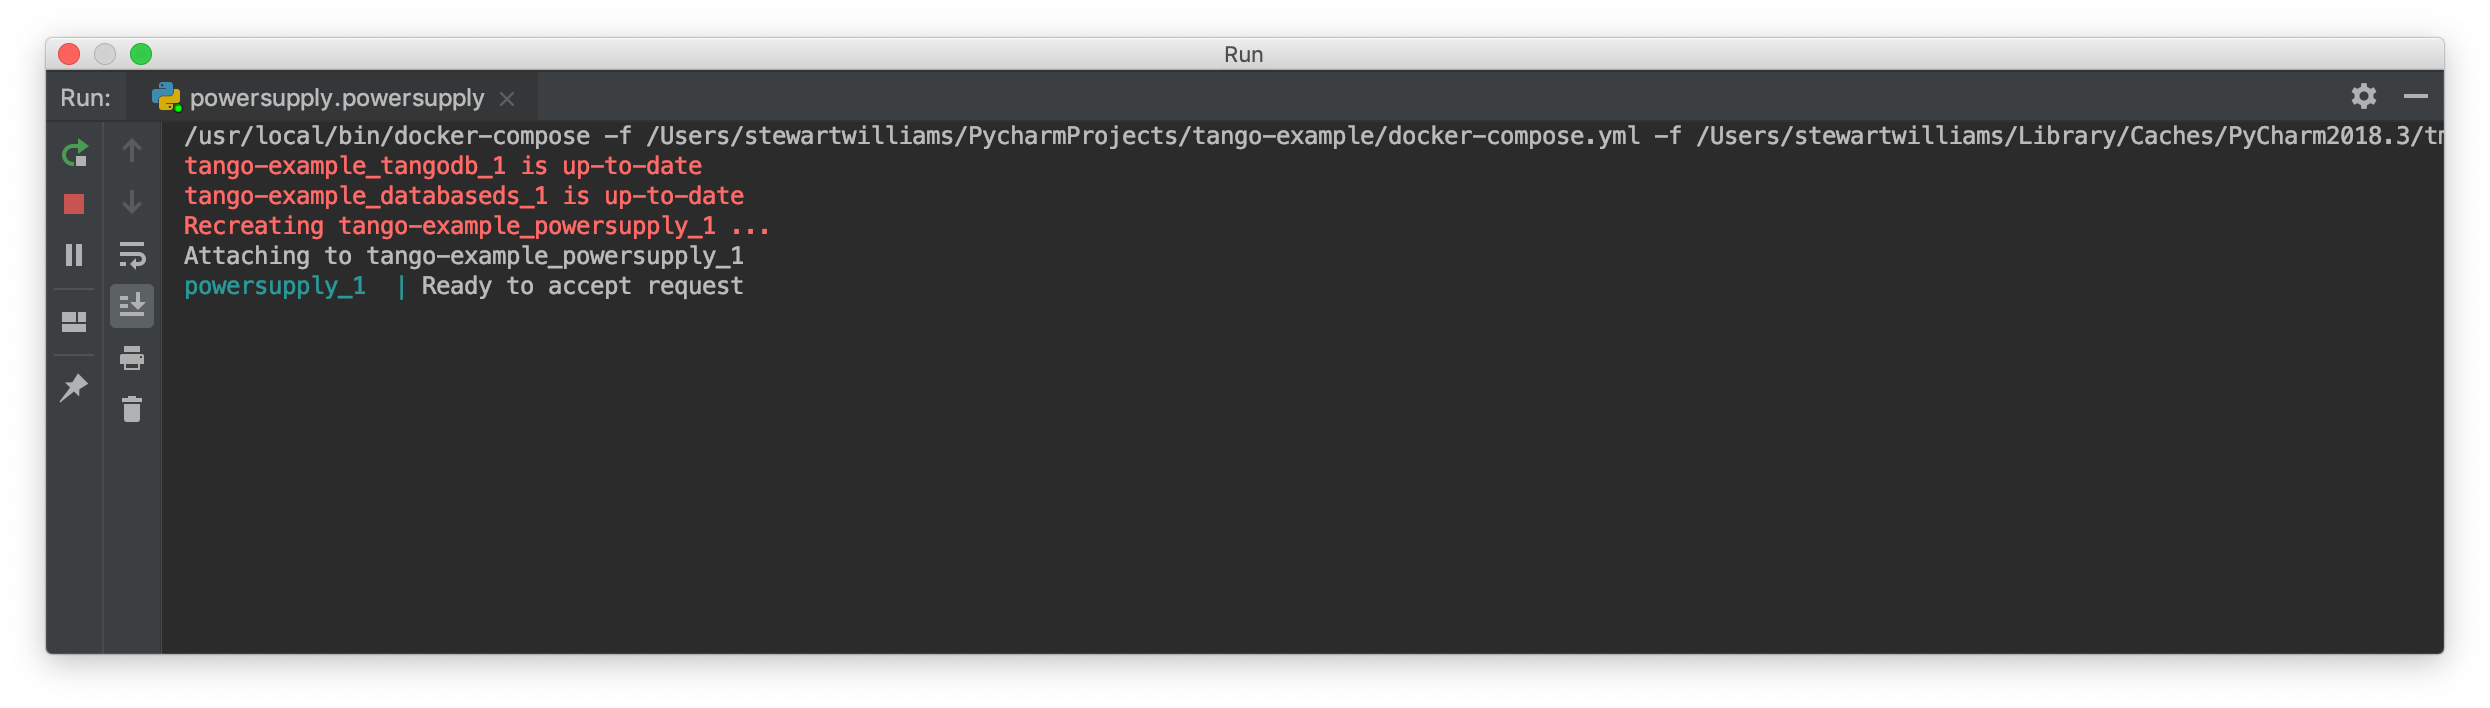
From the main menu, choose Run | Run… and select the configuration that you just created in the Run dialog that opens. The PowerSupply device will launch alongside the partner containers defined in docker-compose.yml. PyCharm’s Run panel will display output like this, showing the device is executing and ready to accept requests.
Debugging configuration and limitations
The Run configuration also functions as a Debug configuration. Debugging using the docker-compose configuration behaves identically and is subject to the same limitations as debugging using the Docker configuration. If you are familiar with these limitations then free to skip ahead to the next section.
Note
The coverage module is not compatible with the PyCharm or Visual Studio Code debugger and must be disabled
before any debugging session. Do so by editing setup.cfg, commenting out the addopts=... line of the
tool:pytest section so that it looks like this:
[tool:pytest]
testpaths = tests
#addopts = --cov=powersupply --json-report --json-report-file=htmlcov/report.json --cov-report term --cov-report html --cov-report xml --pylint --pylint-error-types=EF
PyCharm has a debug mode that allows breakpoints to be added to code and the runtime state of the device examined. Refer to the official PyCharm documentation for comprehensive documentation on how to add breakpoints and run in debug mode.
The steps in the official documentation can also be used to debug and interact with ah Tango device, using the
configuration set up in the previous section as the basis for the debug configuration. However, full breakpoint
functionality requires some workarounds. Breakpoints set outside device initialisation code (i.e., outside
__init__() and init_device()) only function if the Tango device uses asyncio green mode. In non-asyncio
modes, Tango creates new Python threads to service requests. Unfortunately these threads do not inherit the debugging
configuration attached by PyCharm.
For working breakpoints, there are two solutions:
- the device must be converted to use asyncio green mode;
- add
pydevdto your Piplock as a project dependency, rebuild the Docker image and refresh the project skeletons, then addpydevd.settrace()statements where the breakpoint is required. For example, to add a breakpoint in thePowerSupply.get_current()method, the code should look like this:
def get_current(self):
    """Get the current"""
    import pydevd
    pydevd.settrace()  # this is equivalent to setting a breakpoint in IDE
    return self.__current
Debugging unit tests
To debug a unit test, we want the unit tests to run in one container while the PyCharm debugger runs and is attached to the PowerSupply device in another container. The easiest way to accomplish this is to launch the device using the debug configuration while the tests we are examining are executed from an interactive session.
First, launch an interactive session with make interactive. Keep this session open as we will return to it later.
Note
launching make interactive refreshes and recreates the containers defined in docker-compose.yml. Any devices launched by PyCharm will be stopped, requiring the device to be started again in PyCharm once the interactive session is up and running. In short, if you use ‘make interactive’ while devices are running, expect to have to restart your devices in PyCharm.
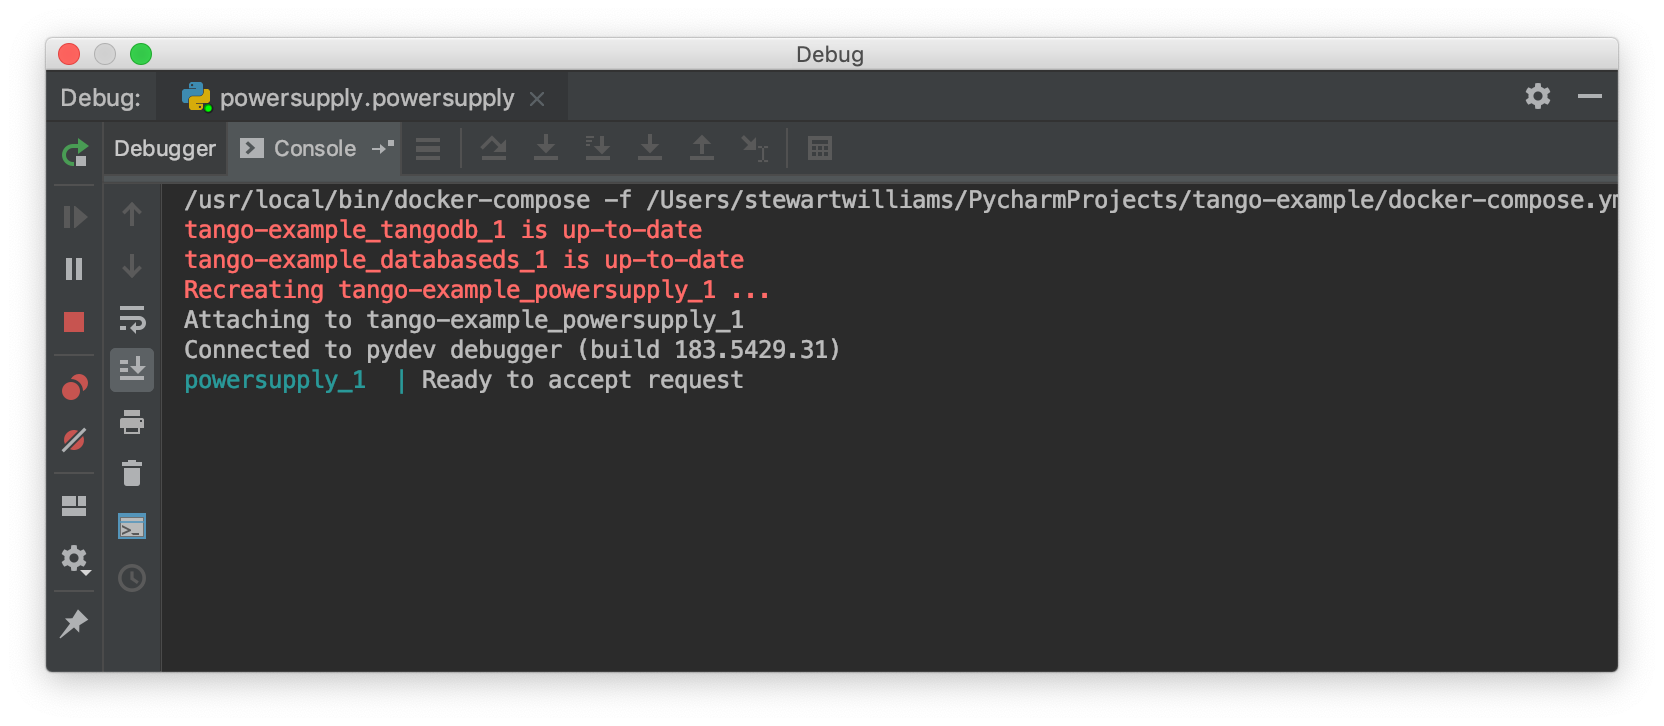
From the main menu, choose Run | Debug… and select the PowerSupply run configuration you created earlier. The device will be launched and the PyCharm debugger attached to the session. The Debug panel of PyCharm should look similar to this:
Returning to the interactive session, run the unit tests that exercise the live Tango device. For the tango-example project, these tests are found in the file test_2_test_server_using_client.py.
tango@069dde501ca7:/app$ pytest tests/test_2_test_server_using_client.py
============================= test session starts ==============================
platform linux -- Python 3.5.3, pytest-4.2.0, py-1.7.0, pluggy-0.8.1
rootdir: /app, inifile: setup.cfg
plugins: pylint-0.14.0, metadata-1.8.0, json-report-1.0.2, cov-2.6.1
collected 5 items

tests/test_2_test_server_using_client.py .....                           [100%]

=========================== 5 passed in 0.18 seconds ===========================
Set a breakpoint in the PowerSupply.turn_on() method and a single unit test that exercises this function.
tango@069dde501ca7:/app$ pytest tests/test_2_test_server_using_client.py -k test_turn_on
============================= test session starts ==============================
platform linux -- Python 3.5.3, pytest-4.2.0, py-1.7.0, pluggy-0.8.1
rootdir: /app, inifile: setup.cfg
plugins: pylint-0.14.0, metadata-1.8.0, json-report-1.0.2, cov-2.6.1
collected 5 items / 4 deselected / 1 selected

tests/test_2_test_server_using_client.py .                               [100%]

==================== 1 passed, 4 deselected in 0.15 seconds ====================
The tests execute but unfortunately the breakpoint is not hit. This is because breakpoints in the main body of the device are not activated (see Debugging configuration and limitations for the reasons for this). To work around this, a breakpoint must be introduced into the code itself. Edit the turn_on method in powersupply.py to look like this:
@command
def turn_on(self):
    """Turn the device on"""
    # turn on the actual power supply here
    import pydevd
    pydevd.settrace()
    self.set_state(DevState.ON)
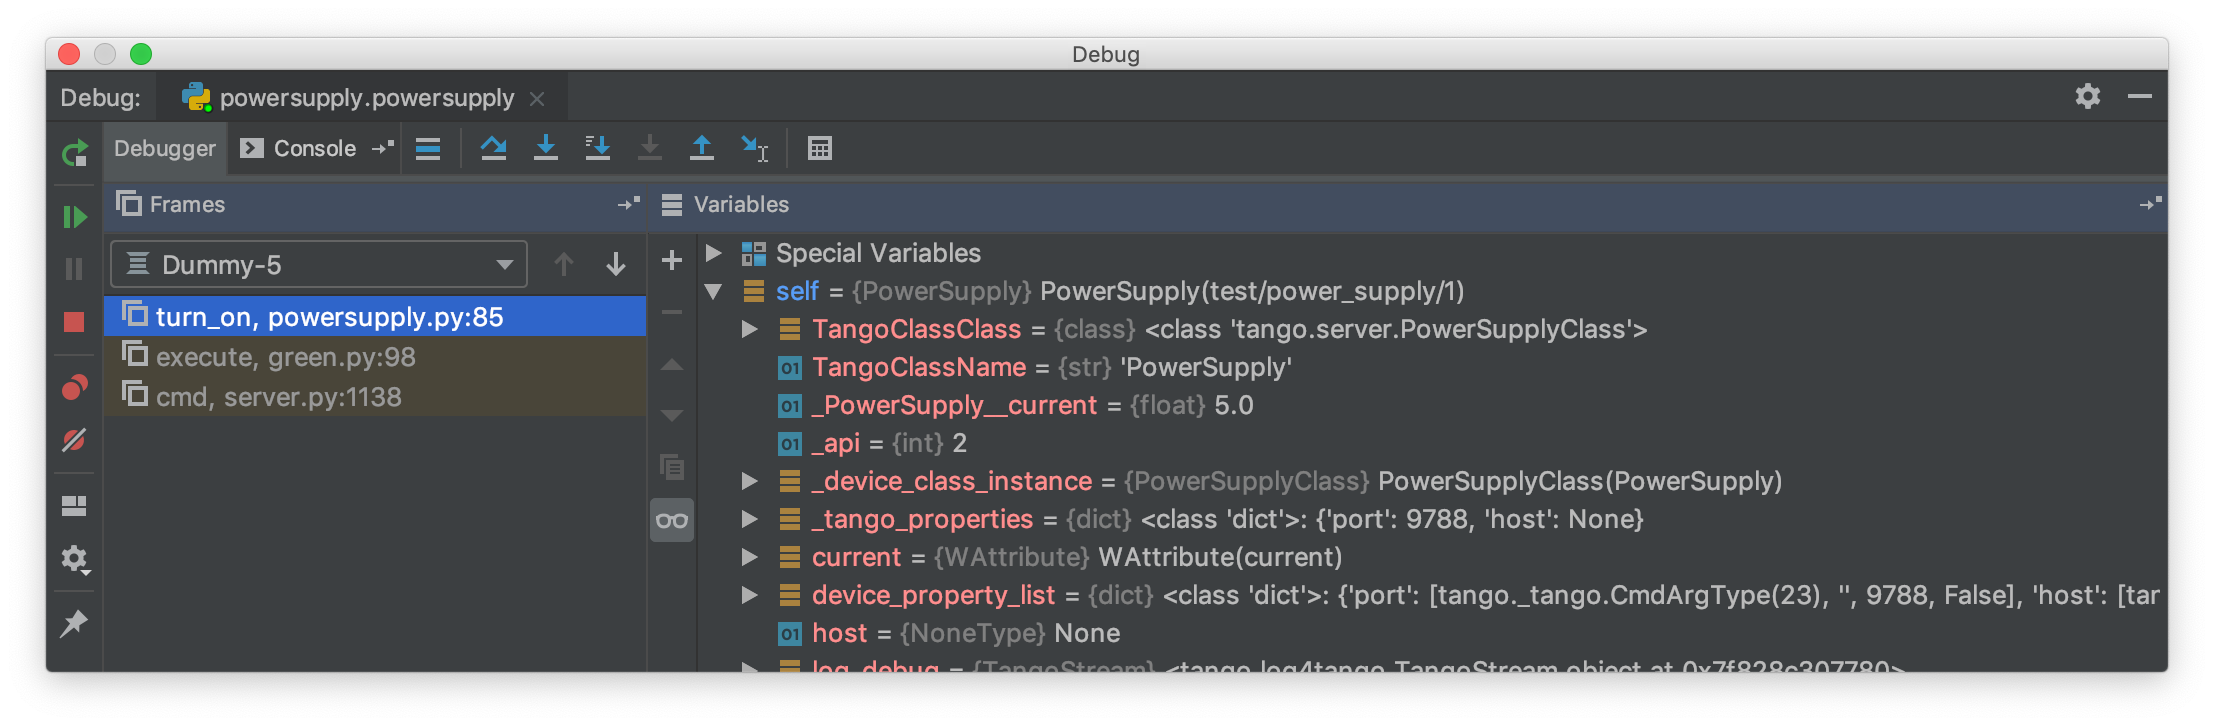
Restart the debugging configuration for the code change to take effect and re-execute the test in the interactive session. This time, the breakpoint is respected and execution is frozen, allowing program state to be examined in PyCharm. The debug panel in PyCharm will look something like this, showing that execution is frozen:
Troubleshooting
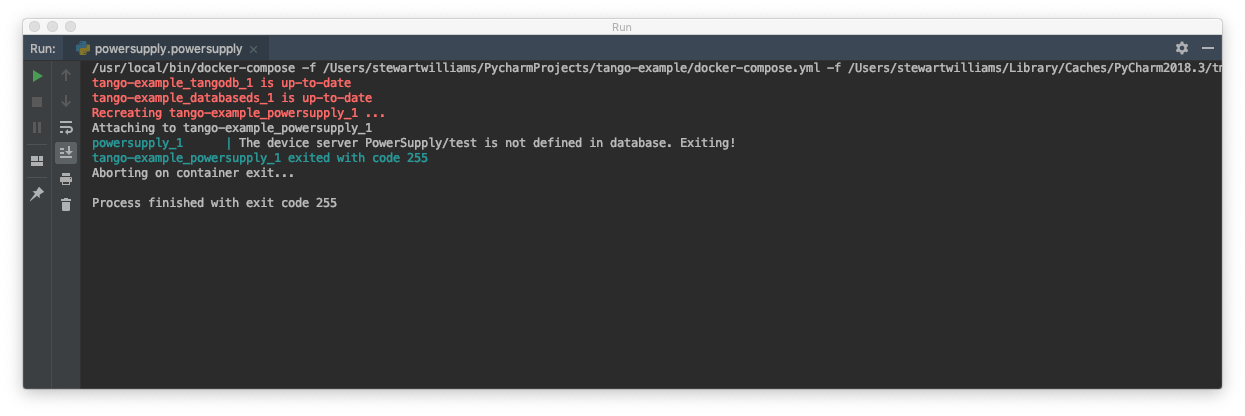
The device server is not defined in the database
If you see an error message like the one below, then the device is unregistered and needs to be registered manually. Follow the steps in Registering the device server.
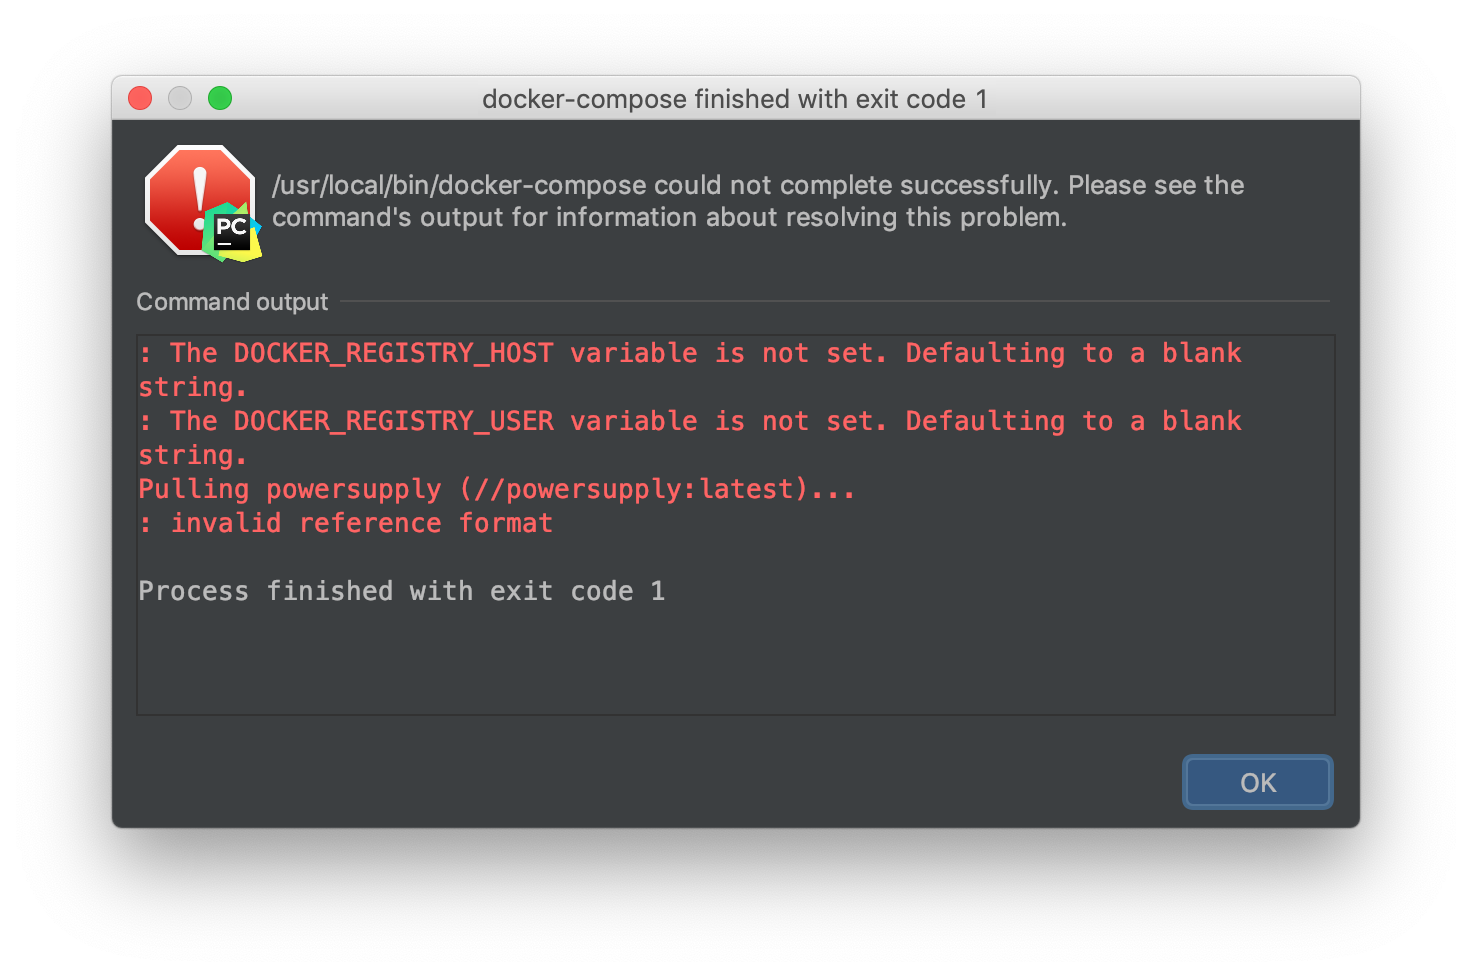
The DOCKER_REGISTRY_HOST variable is not set
If you see an error message like the one below, then you forgot to define the environment variables for the remote interpreter. Edit the variables section in your PyCharm docker-compose configuration and try again.