Continuous Integration
Configuring a CI pipeline
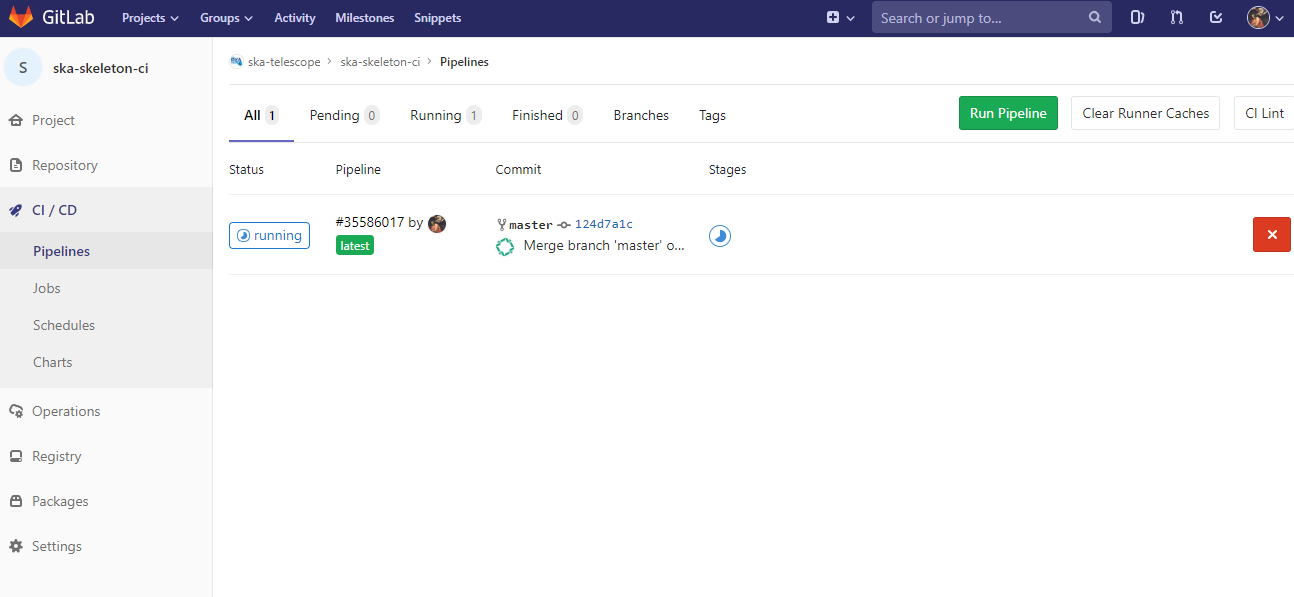
To enable the Gitlab automation, it is needed to insert a configuration file that must be placed in the root of the repository and called “.gitlab-ci.yml”. It mainly contains definitions of how your project should be built. An example of it can be found within the project “ska-python-skeleton” available here. Once the file is in the root directory, it is possible to run the CI pipeline manually (creating a pipeline) or with a commit in github as soon as the mirroring finishes. The following pipeline was created manually pressing the button “Run pipeline” on a specific branch (i.e. master).
Automated Collection of CI health metrics as part of the CI pipeline
As part of the CI/CD process all teams are expected to collect and consolidate the required code health metrics. Namely unit tests, linting (static code analysis) and coverage.
Part of the CI/CD functionality is to add a quick glance of those metrics to each repository in the form of badges. These badges will always show the status of the default branch in each repository.
Teams have the option to use the automatic parsing of their CI and code
health metrics and have the badges created automatically as long as the output
from their code health reports follows the requirements described bellow.
As an alternative the teams can instead create the ci-metrics.json
file themselves according to what is described in
Manual Metrics.
These metrics reports must pass the following requirements:
- These files must not be part of the repository, but be created under
their respective steps (
test,linting) in the CI pipeline. - Unit Tests report must be a JUnit XML file residing under
./build/reports/unit-tests.xml - Linting report must be a JUnit XML file residing under
./build/reports/linting.xml - Coverage report must be a XML file in the standard used by Coverage.py
residing under
./build/reports/code-coverage.xml - The XML format expected for the coverage is the standard XML output from
Coverage.py for Python or from a
similar tool like Cobertura
for Javascript with the
line-rateattribute specifying the coverage. See the example code bellow.
<?xml version="1.0" encoding="UTF-8"?>
<coverage branch-rate="0" branches-covered="0" branches-valid="0" complexity="0" line-rate="0.6861" lines-covered="765" lines-valid="1115" timestamp="1574079100055" version="4.5.4">
In order to automate the process as much as possible for the teams, the ci-metrics-utilities repository was created and it will automate the all metrics collection, and badge creation as long as the 5 points above are observed.
In order to use this automation, the following code must be added at the end of
.gitlab-ci.yml
create ci metrics:
  stage: .post
  image: nexus.engageska-portugal.pt/ska-docker/ska-python-buildenv:latest
  when: always
  tags:
    - docker-executor
  script:
    # Gitlab CI badges creation: START
    - apt-get -y update
    - apt-get install -y curl --no-install-recommends
    - curl -s https://gitlab.com/ska-telescope/ci-metrics-utilities/raw/master/scripts/ci-badges-func.sh | sh
    # Gitlab CI badges creation: END
  artifacts:
    paths:
      - ./build
Manual Collection of CI health metrics as part of the CI pipeline
The teams that prefer to create their own ci-metrics.json file instead
of using the provided automation, can do so. They are still expected to observe
all the points described in Automated Metrics.
The ci-metrics.json file is expect to be created automatically as part
of the CI pipeline by the teams by collecting the relevant information from the
unit tests, coverage, linting and build status.
An important point to notice, is that ci-metrics.json shouldn’t
exist as part of the repository, but, be created specifically as part of the CI
pipeline.
The file must be created and properly populated before the start of the marked
stage: .post step in the CI pipeline (.gitlab-ci.yml file).
The metrics should be collected under the following structure:
- commit-sha (string): sha tag for the git commit
- build-status: top level placeholder for the build process status
- last: placeholder about the last build process
- timestamp (float): the Unix timestamp with the date and time of the last build status
- last: placeholder about the last build process
- coverage: placeholder about the unit test coverage
- percentage (float): the coverage percentage of the unit tests
- tests: placeholder about the unit tests
- errors (int): number of test errors
- failures (int): number of test failures - this denotes a serious error in the code that broke the testing process
- total (int): total number of tests
- lint: placeholder about the linting (static code analysis)
- errors (int): number of linting errors
- failures (int): number of linting failures - this denotes a serious error in the code that broke the linting process
- total (int): total number of linting tests
ci-metrics.json example:
{
  "commit-sha": "cd07bea4bc8226b186dd02831424264ab0e4f822",
  "build-status": {
      "last": {
          "timestamp": 1568202193.0
      }
  },
  "coverage": {
      "percentage": 60.00
      },
  "tests": {
      "errors": 0,
      "failures": 3,
      "total": 170
  },
  "lint": {
      "errors": 4,
      "failures": 0,
      "total": 7
  }
}
Using a specific executor
The pipeline by default will run with a shared runner made available from GitLab. It is also possible to assign specific ska runner to the project (by adding the tags). To do that the option must be enabled:
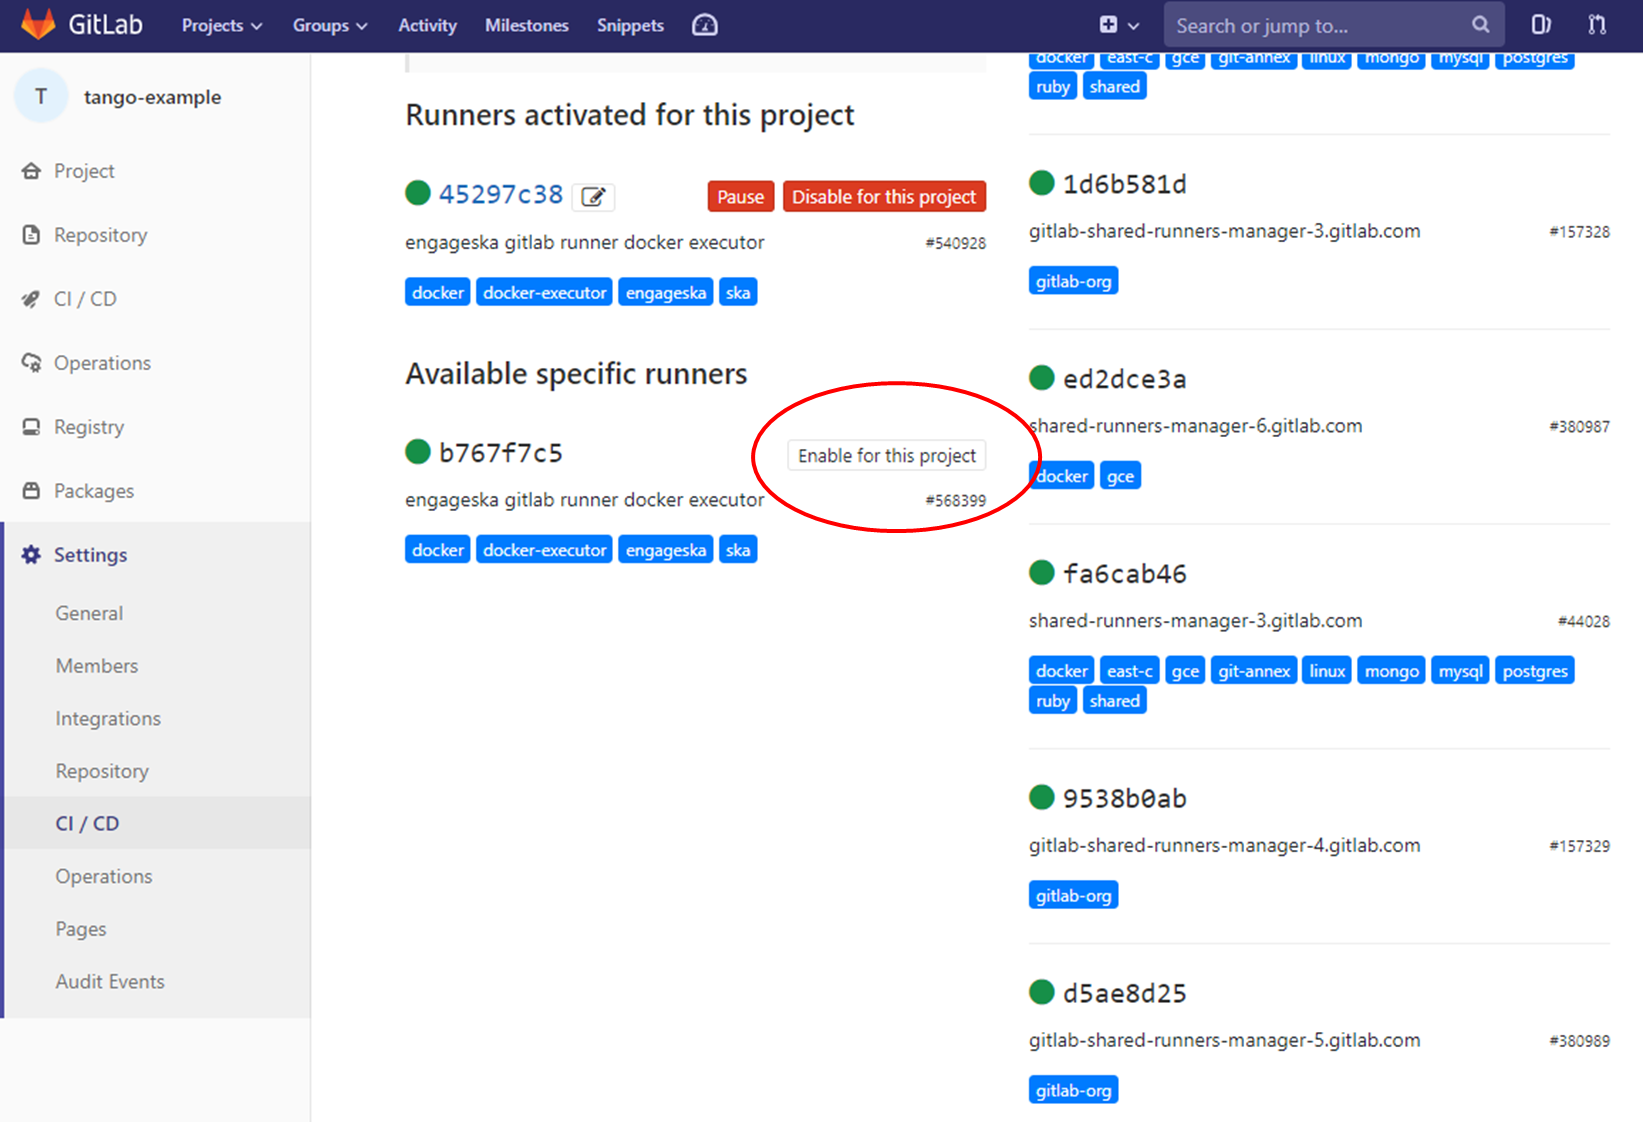
The EngageSKA cluster located at the Datacenter of Institute of Telecommunication (IT) in Aveiro provides some virtual machines available adding the tag “engageska” or “docker-executor” as shown here.
CI pipeline stage descriptions
Caution
This section is a work in progress
The CI/CD pipeline will ensure that software projects are packaged, tested and released in a consistent and predictable manner. SKA Pipelines are viewable and executable at https://gitlab.com/ska-telescope
General Notes
Every commit could potentially trigger a pipeline build. There may be different rules applied to determine which stages are executed in the pipeline based on factors like the branch name.
- E.g Every commit in a feature branch may trigger the “Lint” stage, but not a slow test suite.
When doing a release with a git tag, the full pipeline will be run.
Every pipeline job is associated with its git commit (including tag commits).
Try and have the stages complete as fast as possible.
- In some cases it may be possible to parallelize jobs. For example, unit tests and static analysis could be run in parallel.
All projects must include all the stages listed below.
Project dependencies must be stored in, and made available from the SKA software repository.
All tests must pass on the “master” branch and should be kept stable.
Stages
Build
The build stage packages/compiles the software project into distributable units of software. The project will be checked out at the git commit hash. This specific version of the code must then be built. Failing the build stage will stop the further steps from being executed. Where possible Semantic Versioning should be used. To create a release a git tag should be used. See Release Procedure.
- Input
- Git commit hash
- Output
- A distributable unit of software. E.g .deb .whl .jar or docker image. These must be stored as part of the artifacts and will then be available to subsequent jobs. One could also store metadata together with the artefact, such as a hash of the binary artefact. This should be provided by our artefact registry.
Linting
The static analysis stage does static code analysis on the source code such as Linting.
- Input
- None
- Output
- Quality analysis results in JUnit format.
Test
The test stage must install/make use of the packages created during the build stage and execute tests on the installed software. Tests should be grouped into Fast / Medium / Slow / Very Slow categories.
- Input
- The output from the Build stage. E.g .deb or .whl or docker image. Input could also consist of test data or environment.
- Output
- The results of the tests in JUnit format. These need to be added to the artifacts. See Gitlab Test Reports.
- Coverage metrics in JUnit format.
Test types
Todo
- Further define components to be mocked or not
- Further define smoke/deployments tests
- Unit tests
- The smallest possible units/components are tested in very fast tests. Each test should complete in milliseconds.
- Component tests
- Individual components are tested.
- Integration/Interface tests
- Components are no longer being mocked, but the interactions between them are tested. If a component is a docker image, the image itself should be verified along with its expected functionality.
- Deployment tests
- Tests that software can be deployed as expected and once deployed, that it behaves as expected.
- Configuration tests
- Multiple combinations of software and hardware are tested.
- System tests
- The complete solution, integrated hardware and software is tested. There tests ensure that the system requirements are met.
Publish
Once the build and test stages have completed successfully the output from the build stage is uploaded to the SKA software repository. This stage may only be applicable on git tag commits for full releases in certain projects.
- Input
- The output from the Build stage. .deb or .whl for example. This could also include docker images.
- Output
- The packages are uploaded to the SKA software repository.
Pages
This is a gitlab stage publishes the results from the stages to Gitlab
- Input
- The JUnit files generated in each pipeline stage.
- Output
- The generated HTML containing the pipeline test results.
Documentation
Currently the documentation is generated by the “readthedocs” online service. The list of SKA projects available here. The project documentation will be updated and accessible at the following URL https://developer.skatelescope.org/projects/<PROJECT> E.g lmc-base-classes
- Input
- A docs folder containing the project documentation.
- Output
- The generated HTML containing the latest documentation.
Using environment variables in the CI pipeline to upload to Nexus
There are several environment variables available in the CI pipeline that should be used when uploading Python packages and Docker images to Nexus. This will make these packages available to the rest of the SKA project.
Python Modules
The Nexus PYPI destination as well as a username and password is avialable. For a reference implementation see the lmc-base-classes .gitlab-ci.yaml
- Note the following:
- The Nexus PYPI_REPOSITORY_URL is where the packages will be uploaded to.
- twine uses the local environment variables (TWINE_USERNAME, TWINE_PASSWORD) to authenticate the upload, therefore they are defined in the variables section.
publish to nexus:
  stage: publish
  tags:
    - docker-executor
  variables:
    TWINE_USERNAME: $TWINE_USERNAME
    TWINE_PASSWORD: $TWINE_PASSWORD
  script:
    # check metadata requirements
    - scripts/validate-metadata.sh
    - pip install twine
    - twine upload --repository-url $PYPI_REPOSITORY_URL dist/*
  only:
    variables:
      - $CI_COMMIT_MESSAGE =~ /^.+$/ # Confirm tag message exists
      - $CI_COMMIT_TAG =~ /^((([0-9]+)\.([0-9]+)\.([0-9]+)(?:-([0-9a-zA-Z-]+(?:\.[0-9a-zA-Z-]+)*))?)(?:\+([0-9a-zA-Z-]+(?:\.[0-9a-zA-Z-]+)*))?)$/ # Confirm semantic versioning of tag
Docker images
The Nexus Docker registery host and user is available. For a reference implementation see the SKA docker gitlab-ci.yml
- Note the following:
- The DOCKER_REGISTRY_USER corresponds to the folder where the images are uploaded, hence the $DOCKER_REGISTRY_FOLDER is used.
script:
- cd docker/tango/tango-cpp
- make DOCKER_BUILD_ARGS="--no-cache" DOCKER_REGISTRY_USER=$DOCKER_REGISTRY_FOLDER DOCKER_REGISTRY_HOST=$DOCKER_REGISTRY_HOST build
- make DOCKER_REGISTRY_USER=$DOCKER_REGISTRY_FOLDER DOCKER_REGISTRY_HOST=$DOCKER_REGISTRY_HOST push